Datalogger (G4667920)
Activation of Data Logger
Open the Diagnostic Device Agent (DDA) and select Start Data Logger.
DDA will launch a new internet browser page with a different IP address. For the best user experience, JLR recommend using the Google Chrome browser.
For the Start Data Logger function to be active within the DDA function panel, you must connect the Vehicle Communication Interface (VCI) to the vehicle and diagnostic machine and login to the DDA and TOPIx.
Upon successful connection to a vehicle and authentication of the user within TOPIx, Start Data Logger will become active and useable. This will be indicated by a green tick next to the DDA and Vehicle Identification Number (VIN).
If the DDA icon displayed in the Windows lower tool bar is selected, Stop Data Logger icon is now displayed. This allows you to close and exit the Data Logger and return the DDA to TOPIx Cloud Diagnostics.
WiFi Connection must be available for a successful connection to TOPIx Cloud Diagnostics, otherwise failure to connect to the cloud will occur.
Windows pop-up messages will be displayed to indicate the status of the DDA and its connection to the TOPIx Cloud Diagnostics. If the DDA disconnects from the vehicle, the Data Logger set up screen will show a the message: 'Waiting for connection to Diagnostic Device Agent' and the green ticks will be replaced by a red cross and 'No Vehicle Connected' is shown in the position of the VIN. refresh the Data Logger screen to reset the connection to the DDA and the vehicle.
Setup of Data Logger
Select a module or modules to read signal data from.
More than one module can be selected and used for signal interrogation and display on the Data Logger screen.
Select a Data IDentifier (DID), which are the signals or data that are to be investigated.
Multiple DIDs can be selected from one or more modules. However, you must be aware that more than 20 signals being selected and monitored will marginally reduce the response time, precision and accuracy of data being acquired and displayed from one or more modules.
Filter Module List can be used to reduce the module list. Enter one or more letters and a module list will be automatically shown, in alphabetical order, that corresponds to the characters entered into the search box.
Select START to read the DID value.
Select the line of the selected module or modules that will expand to show the stored DID content that is available to use. The DID content may reduce or increase over time as updates are received from JLR Engineering.
Filter DID List can be used to reduce the DID list to allow for easier identification and selection. Text entries can consist of letters, words or the specific DID number and the filtered list will adjust automatically to the text entered.
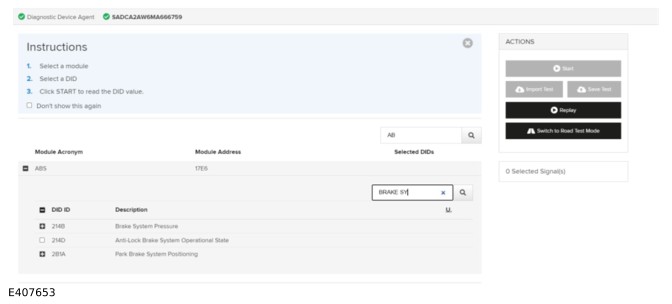
Select the line of the DIDs shown or expand the options it the DID contains a combination of signals. The number of DIDs selected for capture will be displayed under the Selected DIDs column.
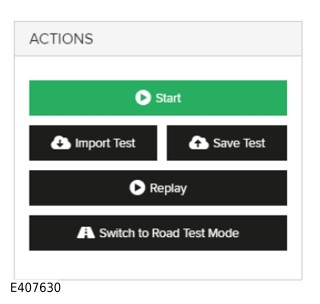
The ACTIONS panel will become active when a DID or DIDs have been selected.
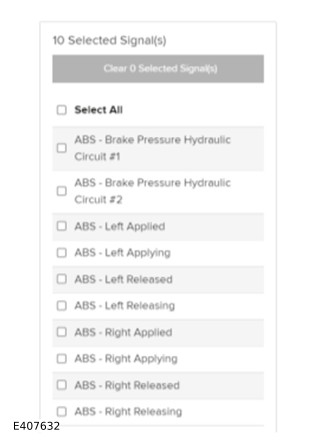
A Selected Signal(s) panel will appear underneath that displays the number and name of the selected signals. This panel can be used to clear one, some or all of the selected signals quickly and easily.
DID / Signal Capture
When the DIDs / Signals have been identified and selected for capture, Start will become active and can be selected within the ACTIONS panel. Stop will also be made available to stop the Data Logger.
Pause will freeze the image of the graphic displays, but the process will continue to run in the background. This means data is not lost and can be referred to when Resume is selected.
An instruction panel is shown when the Data Logger signal capture is started. The instruction panel informs you how to manually manipulate the graphical displays to your preference.
Move the cursor over any point of the graphical display to show the details of the current time in hours / minutes. The time duration, in seconds, of the monitored signal is displayed on the bottom of the display and the signal value is on the left of the display.
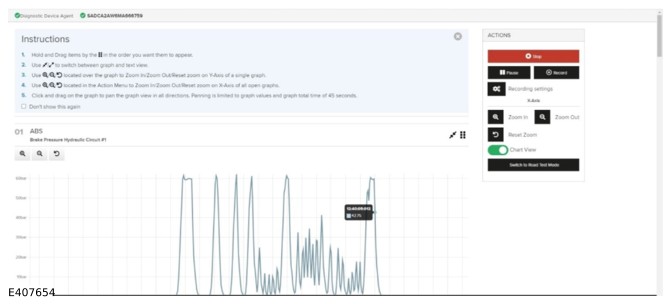
Chart View
Movement of the Chart View slider located within the ACTIONS panel will automatically convert all graphical displays to the chart view that shows alphanumeric data only of each signal being mentioned.
Select the expanding arrows symbol on any chart view signal to manually change the chart to a graphical view of the data. To return to the chart view of the signal, select the contract arrows symbol.
Road Test Mode
Use Road Test Mode when Data Logger is required to capture signal data while the connected vehicle is driven on a drive cycle (a second person may be required for the drive cycle).
The screen will switch to simple, clear function icons so that the driver of the vehicle will not be distracted by the Data Logger's activity.
When the vehicle is stationary in the workshop, setup Data Logger by selecting the DIDs / signals that are required for data capture.
Select Switch to Road Test Mode.
Select Start to activate the Data Logger in Road Test Mode. Data Logger now reads the selected signals. Select Stop to end the data capture.
Select Record to permanently capture the data. As a default, a data file will be saved to the machine's local downloads folder when Stop Recording is selected.
Select Switch to Normal Mode while the current Data Log session is active. The screen will change to show the graphical or chart views.
Stop Recording produces an automatic delivery of a Data Log file shown at the bottom of the screen. Select Show all to go to the downloads area and there will be an option to go to the specific downloads folder if required. The saved files can now be transferred to another user or machine, or they can be applied to a TOPIx feedback or TOPIx Technical Support request.
Replay
TOPIx Data Logger has the ability to replay previously saved Data Log files. Select Replay within the ACTIONS panel.
Provide Retailers a Way of Replaying Completed Applications
Data Logger will display a new pop-up window, allowing you to select a Data Log file. The location of the file is normally the downloads folder. However, the preference can be manually changed, and this will become the default location. Select a file, and Open in the pop-up window. Data Logger will automatically show the captured data signals that were used previously for the recording.
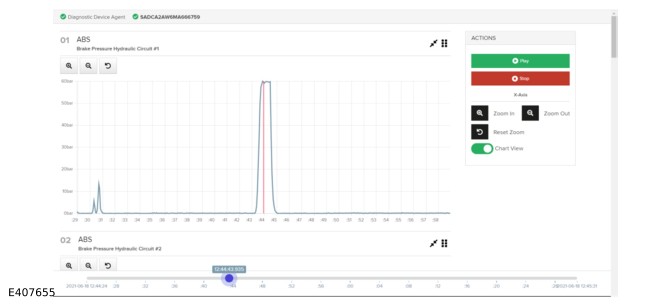
In Replay mode, Play, Stop and all other graphical / chart views features are available to use. There is also a feature where you can scroll through the complete time duration of the recording by simply dragging the slider ball backward and forward along the guide. The red marker line on the graph corresponds with the time information shown on the slider ball, It can also be used for identification or as a reference point for fault detection.
Import and Save Test
This feature can be used when there is a known test that needs to be ran consecutive times and can be used on other vehicles that share the same module variant and data. The exact data required is obtained from the vehicle modules, which enables faster diagnosis and repair times.
Select Import Test and TOPIx will automatically show a pop-up window of the download folder on the local machine. If the required file is not located in the download folder, you can manually select the location and select the file to import.
Select Replace current configuration to clear any signals that have been previously selected and active, and to replace them with the signals stored within the imported file.
Select Add to current configuration to show the additional imported signals with those originally in use. For example, if two signals are selected and in use for a module and the imported signals contain four more, the result will be that six signals are active and ready for use on Data Logger. The additional signals can be from one or multiple modules.
Save Test allows the current set of signals to be saved to a preferred location on your machine. Enter the text for the name of the file and select Save to disk. The file will then be saved to your downloads folder by default.
Playback
The Data Logger playback displays the filename of the recording being played on the screen’s header, alongside the VIN and the TOPIx Cloud connection status.
The feature will avoid confusion when diagnostics involves reviewing multiple Data Logger recordings. It allows you to keep track of which recording is being reviewed.
Key Features
- Displays the filename of the Data Logger recording being played
- Displays the VIN

How to Use Data Logger Playback
- Select one of the following:
- a) If reviewing Data Logger recordings and no vehicle is connected, select the DDA icon from the windows tool tray and select Start Data Logger
- b) If a vehicle is connected, wait for the connection process to complete from the Option Selection Screen select Browse All
- Select the Diagnostics tab at the top of the page.
- In the Diagnostics tab, from the Vehicle Data Screen select the Data Logger icon.
- From the right of the Data Logger screen, select Replay.
- From the file browser popup select your required recording. All Data Logger recording files will have a json.gz file type.
- The recording is now on the screen with playback options.
Assign a Custom Name to Data Logger Recordings
You can assign a customized filename to a recording captured with Data Logger.
This provides a popup on screen when a Data Logger recording has been taken, allowing you to enter your filename, making it easier for you to distinguish between multiple recordings.
Data Logger global search function
The Global Search function allows you to search for a Parameter ID or Parameter Description from all modules listed.
With a VIN in session, enter the value to be searched in the new search bar at the top of the Data Logger module list screen.
The search function also accepts partial search terms. For example, if Pressure is searched, then all parameters that contain the word Pressure from all modules will be presented on screen for selection.
Nominal values display
The nominal values for a parameter are published and pushed to all connected machines instantly.
Where a nominal value has been published for a parameter, there will be a shaded area on the graph view for that parameter, making it easy to identify if a signal is outside of the nominal value.
How to override the set nominal value- Select a parameter from the list of available parameters on the module list screen.
- From the right-hand pane named Action, select Signal Settings.
- The published nominal values for the parameter will be displayed in the Nominal Value Start text box and the Nominal Value End text box. If required, you can amend the nominal values in the text boxes.
- When the Data Logger is started, the new values that you have entered will be used.
Diagnostic Trouble Codes (DTC) to have related Data Logger signals mapped to them
This feature allows JLR engineering to map Parameter Identifiers (PIDs) to DTCs, allowing Data Logger to be launched directly from a DTC, with the mapped PIDs pre-selected for logging.
This feature is only available from within a workflow, at Step 2 – Test plan. To use this functionality:
- Start a Fault and Breakdown workflow. Enter the symptoms associated with customer concern.
- Navigate down to the Test Plan table and select ‘Investigate a DTC’.
- A list of DTC's present on the vehicle will now be displayed. Select the DTC relevant to the vehicle concern.
- This DTC will now be added to a new table below the Test Plan table. The DTC can be selected from this new table to view the DTC snapshot data and DTC help text.
- The last column in the Data Logger table will show either a ‘Run’ icon if the selected DTC has PIDs mapped against it. If no PIDs have been mapped then there will be text stating ‘No signals have been assigned to this DTC.
- To learn how to clear and read DTCs, refer to this video: Clear and Read DTCs Per Module (from workflow)
- To learn how to investigate DTCs and launch Data Logger, refer to this video: Investigate DTCs and launch Data Logger (from workflow)
PROVIDE AN ABILITY TO DELETE AND RENAME SAVED Data Logger TESTS IN Data Logger
This feature will allow you to delete and rename Data Logger tests that have saved to your TOPIx cloud profile. Prior to this feature, when a Data Logger test had been saved it was not possible to change the title or remove it.
- You must be a registered user, signed into TOPIx.
- Select TOPIx Home Page to open the vehicle search page.
- Enter a VIN from the Vehicle Search Page.
- In the OPTION SELECTION menu select Fault and Breakdown.
- Select Diagnose a Fault.
- Enter Symptoms (For example Body, Lighting, Exterior lighting, Headlamp Concern) then continue.
- From the Test Plan Table, select Launch Data Logger.
- When Data Logger has launched, from the right hand of the screen select Manage Tests.
- A pop-up will appear showing all tests saved to your user profile.
- a) To edit a Data Logger test name, select the edit icon next to the test that needs to be edited
- b) To delete a Data Logger test, select the delete icon next to the test that needs to be deleted
To learn how to use the Data Logger user guide, refer to this video: Data Logger User Guide
To learn how to create a test template in Data Logger, refer to this video: Creating a test template
To learn how to record and replay in Data Logger, refer to this video: Creating a recording and replaying
To learn how to chain signals to one graph in Data Logger, refer to this video: Chain signals to one graph